In the two years we’ve worked with local nonprofits, events and associations, one of our biggest frustrations has been a lack of accurate measurement for local entities. We’ve used Moz’s Domain Authority, which provides understanding of the quality and influence of an organization’s website. But there’s so much more to local influence than quality of a website from a search perspective. While we’ve encouraged others to use metrics like email newsletter size and social media followings, we realize these metrics are difficult to view in aggregate across various metro areas.
So we developed Reach Score.
Reach Score is a metric that characterizes local sponsorship opportunities by their influence, or reach, compared with other organizations in the same region. Reach Scores sit on a scale of 1-100, with 100 meaning an organization has the most local reach, compared to all other organizations in the same region. Reach is established by six data points: website Domain Authority (required), Facebook and/or Twitter following (at least one is required), email newsletter subscribers, event attendees, and ZIP code.
Calculate the Reach Score of any local organization here.
Methodology: how we developed Reach Score
We anticipated the need for Reach Score in early 2016, as we developed our internal sponsorship database. But at the time, we didn’t have enough data in our system to draw any strong conclusions on Reach, and other priorities took precedence. We re-ignited the conversation in mid-2017, after a large branding project for a client in Chicago. This project made it clear that Reach needed to be a local conversation; Chicago organizations shouldn’t be compared alongside Boston or Boise organizations. From that realization, we spent seven months gathering data, tweaking algorithms and reviewing Reach Score results. Garrett French and Megan Hannay provided industry analysis and strategy, our data scientist, Alex Thackeray, provided iterations on the algorithm, and our developer, Andy Jones, incorporated APIs and database queries.
The Metrics
The key to developing Reach was to identify meaningful and available metrics that truly captured local influence, then balance those metrics to reflect actual influence in the local community. We looked at (and discarded) a number of candidate metrics, both publicly available and proprietary to ZipSprout, before settling on the three-to-six data points that broadly capture Web influence, social influence, and concrete local influence.
The Algorithm
Once we identified the specific metrics, we experimented with how to combine them. Outliers presented a problem – for example, two out of 3,000 Chicago organizations have over 1 million Facebook followers, so Reach had to allow for those two very high social influencers without skewing all scores in Chicago or creating a huge gap in Reach score between these two organizations and the other 2,998. We also worked through various weighting schemes to smooth out the results without unduly elevating (or punishing) organizations that had a very high score in one metric and very low scores in the others.
Finally, we made Reach dynamic by making it relative to all organizations in a city. An organization can affect its Reach score; and its Reach score is affected by the actions of other organizations. This gives organizations some control over their Reach – it’s not an arbitrary, fixed number. But it also means organizations have to work to maintain their Reach, as other organizations improve their metrics.
Reach really does need to be localized to be meaningful. The metrics we are using reflect local conditions, most notably population, so it doesn’t make sense to compare Reach in Chicago (population 2.7 million) to Reach in Muncie, IN (population 70,000).
We struggled with normalizing the data to reflect the range of values for a given metric – some metrics were mapped to a statistical distribution to generate percentiles, while others were categorized into bins with fixed point values. We checked our assumptions and algorithms over time as we added more organizations to our database – this helped us identify a threshold for launching Reach in a specific city, both in terms of the minimum number of organizations and the expected range of metric values for those organizations.
The Future of Reach Score
Reach score is not yet complete, and while it won’t change as often as Google’s search algorithm, it is not a fixed score like the unemployment rate or other standard government statistics. We are confident in the shape of Reach, but we expect to tweak the formula as we launch it in more cities and as we see how organizations respond to it.
Selecting sponsorships with local Reach Score
Reach score is a way to understand the size of any local organization’s influence; Reach Score is not a ranking of organizations.
For some local organizations, a smaller audience size correlates to a more targeted audience demographic. Local amateur sports teams typically have lower reach than other organizations (a score of 29.5, on average), but they reach very specific audiences of local youth and their families. A middle school softball league may be a more tactical sponsorship choice for, say, a family dentist practice, than a local beer and wine festival.
What Reach Score tells us about local organizations
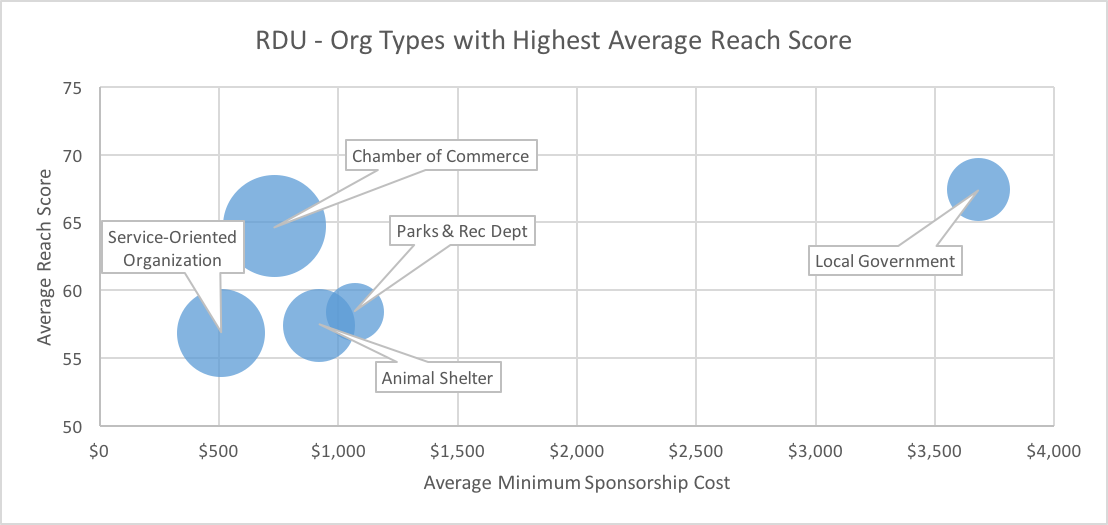
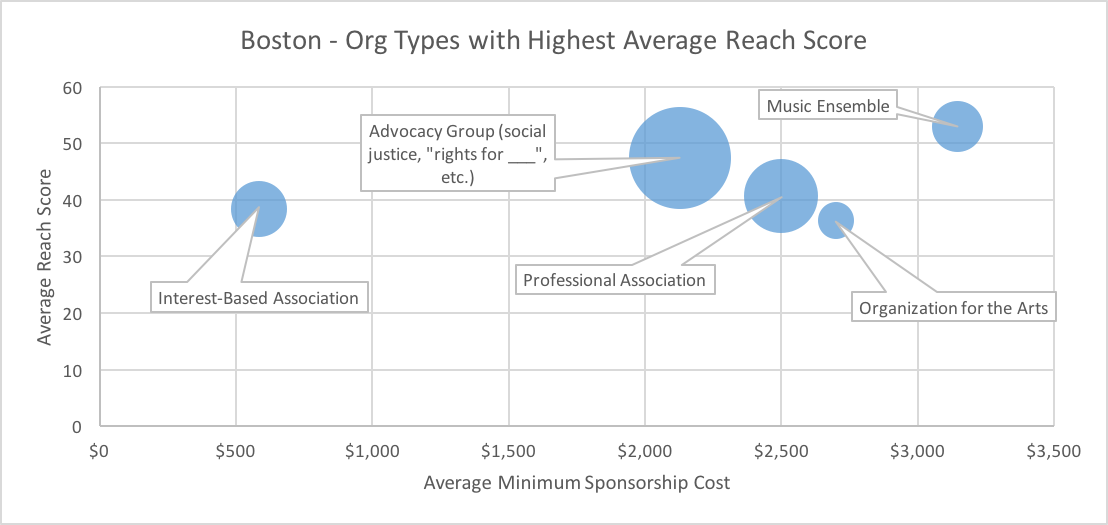
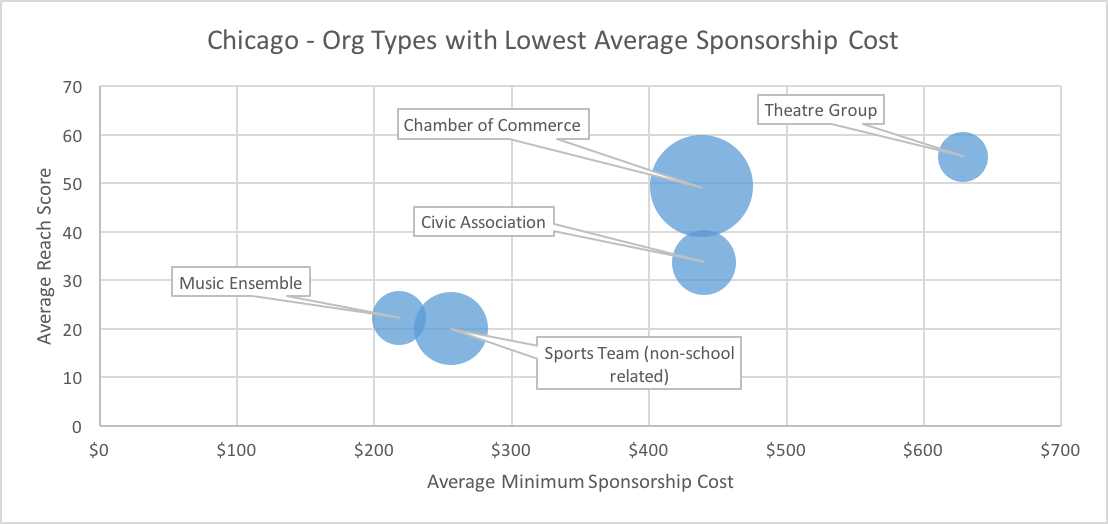
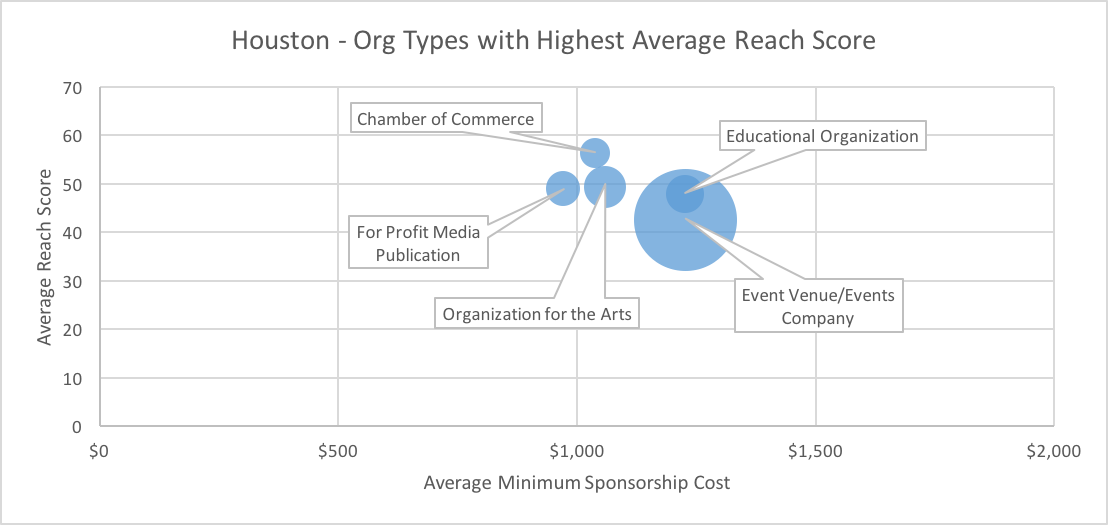
Our reach data from Houston, Chicago, Boston and Raleigh-Durham, reveal the culture of these cities, in terms of the value they place on local organizations.

Raleigh-Durham’s organizations with the highest reach tended to be government organizations, including Chambers of Commerce, and local parks. In Boston, we see more arts organizations, and even music ensembles garnering high reach.

Meanwhile in Chicago…

Just kidding.
In Chicago, we saw arts organizations as well, specifically music and theatre groups. But, unlike Boston, these groups had some of the lowest sponsorship costs in the Windy City. And they weren’t always the highest reach.

Houston, a city we often tell clients is a more expensive option for local sponsorships, lived up to its oil-rich reputation. In most cities, high reach score does not correlate with more expensive sponsorships, but Houston’s high-reach organizations were all correlated to pricier sponsorship opportunities.

We also saw trends across various organizations of the same mission, regardless of city. For example, animal shelters’ Reach Scores average about five points higher than homeless shelters’ scores – 48, compared with 43. The animal shelters earn their score through higher-than-average Facebook followings. Homeless shelters’ Facebook likes are mediocre compared to other organization types, but their Domain Authority tends to be stronger. This data says a lot about where and how these entities earn their influence. Animal shelters rely on strong social media presence to drive messaging. Homeless shelters are typically connected to more influential foundations or government entities that provide web authority, but not as much social reach.
Here’s another example: private schools tend to have higher reach than public schools, in spite of the fact that most public schools have larger student populations. Private schools have higher Domain Authority than their public counterparts, and their social media followings, while not large in comparison with other local organizations, were larger than those of the public school groups in our dataset.
Note: we’d prefer not to take this finding as a sign to sponsor private schools over public schools; rather, this statistic encourages us to find ways to help public schools better communicate with their communities.
More Reach Score
Want to learn more? Hit us up at hello@zipsprout.com. Thoughts and feedback are always welcome, especially from the local nonprofit community, and the local marketing community.
You can calculate the reach score of any local organization, using our Reach Score Calculator.
And we’ll be publishing articles with various Reach Score-related findings on a few marketing blogs in the coming weeks. We’ll link to these posts below as they go live.
Source Data for Graphics
[table id=1 /]
[table id=2 /]
[table id=3 /]
[table id=4 /]


